Visualizing the Spectral Library
Import packages
from importlib import reload
import os
import glob2
import pandas as pd
import numpy as np
import sys
import matplotlib.pyplot as plt
import matplotlib.gridspec as gridspec
import hpfspec
import hpfspecmatch
Read in Library
# download library if does not exist
hpfspecmatch.utils.get_library()
# List of stellar library fits files
library_fitsfiles = hpfspecmatch.config.LIBRARY_FITSFILES

# Read in all files as a HPFSpecList object
HLS =  hpfspec.HPFSpecList(filelist=library_fitsfiles)
# list library stars contained in HPFSpecList object
HLS.splist
# More info on the targets
HLS.df
# Read in required information on all of the
# This has the Teff, Fe/H, and logg for all of the stars
# OBJECT_ID is the HPF name of the star
df_lib = pd.read_csv(hpfspecmatch.config.PATH_LIBRARY_DB)
df_lib
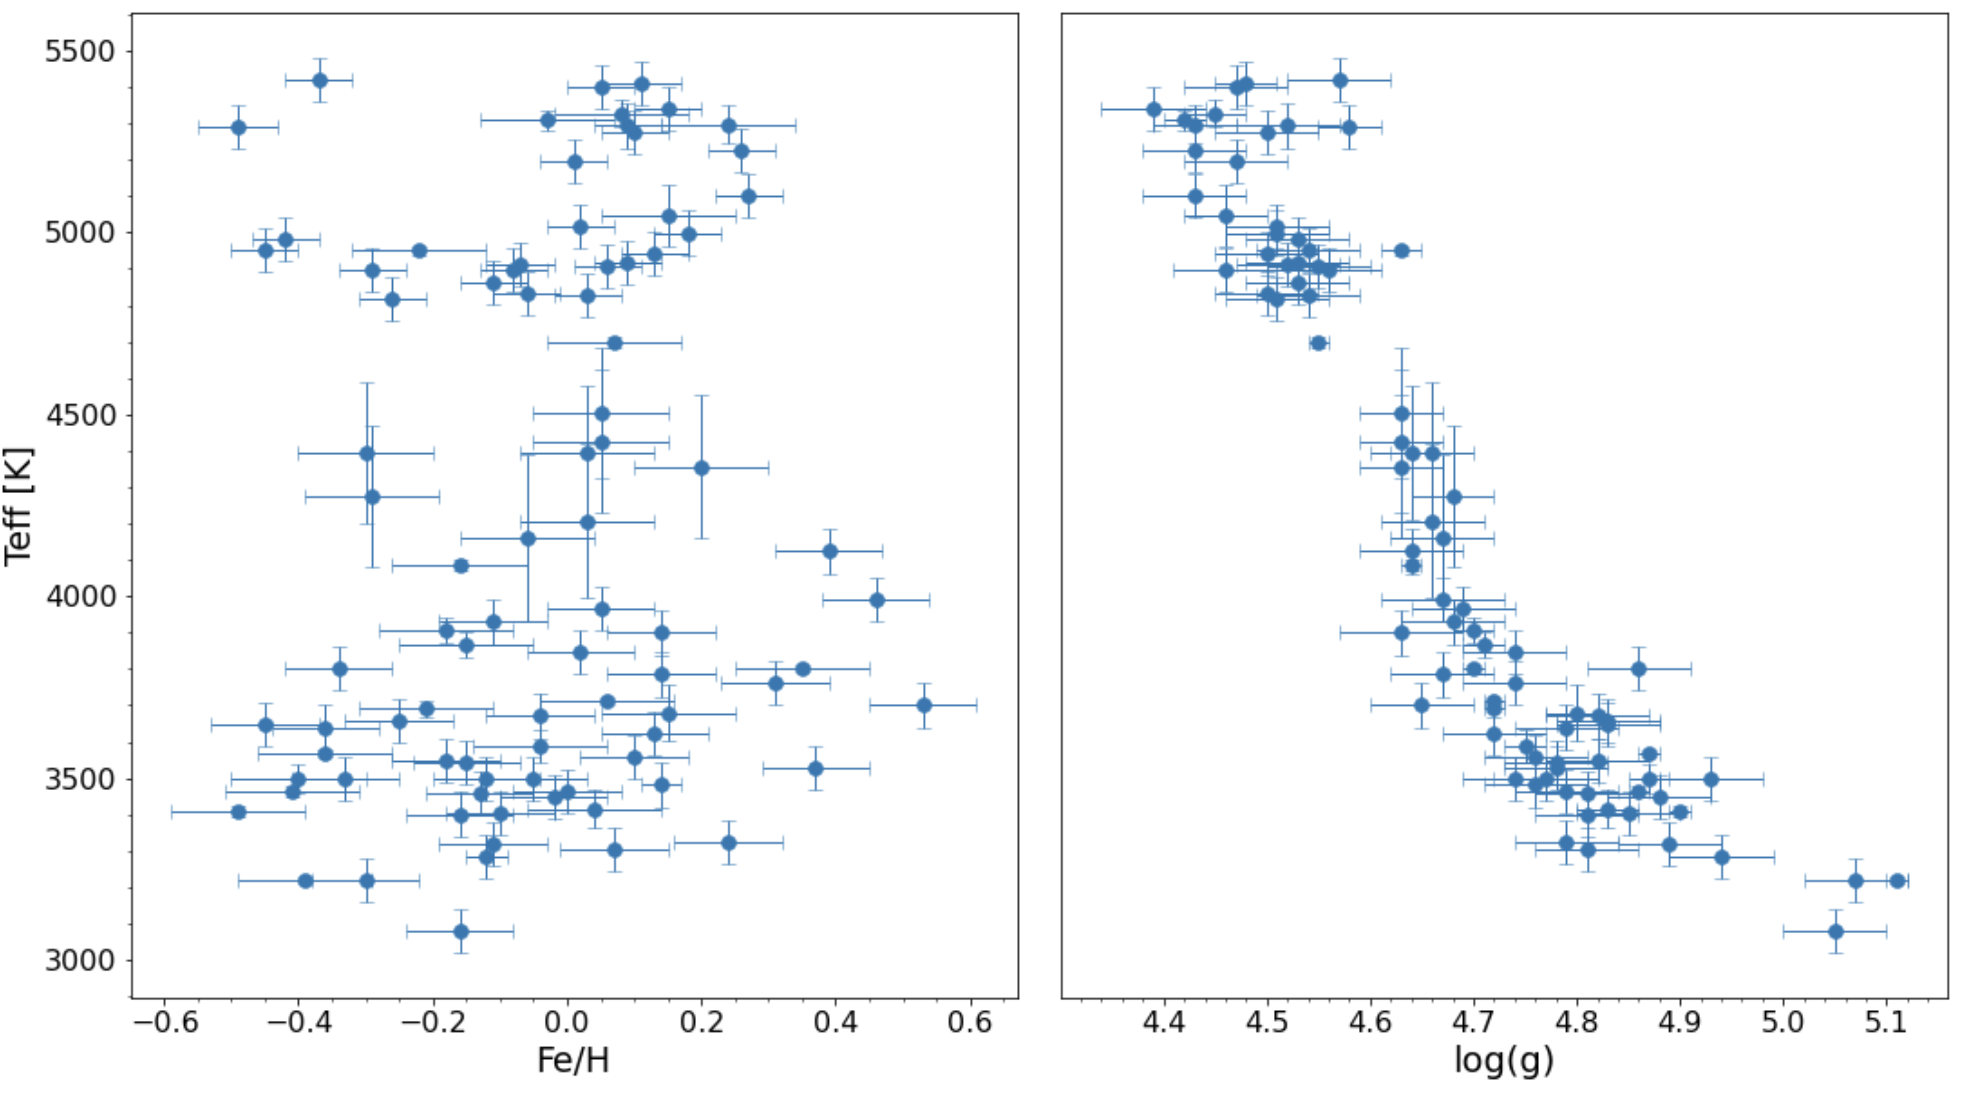
Plot Library
# Plot Teff vs Fe/H and Teff vs logg for all library stars
fig = plt.figure(figsize=(18,10))
gs = gridspec.GridSpec(1, 2)
ax = plt.subplot(gs[0, 0])
bx = plt.subplot(gs[0, 1])

ax.set_ylabel('Teff [K]',fontsize=19)
ax.set_xlabel('Fe/H',fontsize=19)
bx.set_xlabel('log(g)',fontsize=19.5)

ax.tick_params(labelsize=16)
bx.tick_params(labelsize=16)
ax.minorticks_on()
bx.minorticks_on()
bx.axes.get_yaxis().set_visible(False)
fig.subplots_adjust(wspace=0.05)

# Teff vs Fe/H
ax.errorbar(df_lib['[Fe/H]'], df_lib['Teff'],df_lib['e_Teff'],df_lib['e_[Fe/H]'],lw=0,elinewidth=1.,marker="o",mew=0.5,markersize=8,capsize=4);

# Teff vd logg
bx.errorbar(df_lib['log(g)'], df_lib['Teff'],df_lib['e_Teff'],df_lib['e_log(g)'],lw=0,elinewidth=1.,marker="o",mew=0.5,markersize=8,capsize=4);

